
Some time ago, I posted about how gerrymandering works. In the 2012 congressional elections, something… odd… happened.
In North Carolina, at a statewide level, the majority of votes were cast for democratic candidates. It wasn’t a large majority, 50.6% voted Democrat, while 48.75% voted Republican (with Libertarians and write-ins getting the remainder).
It would make sense that, 13 House of Representative seats would be 7 Democrats and 6 Republicans. That’s what the percentages show, right? In an curious and contradictory result, the Democrat party earned 4 seats, while the Republicans earned 9 seats.
That’s a pretty strange result. And the question was asked, Is this the result of gerrymandering? The map below shows the voting districts of the state.
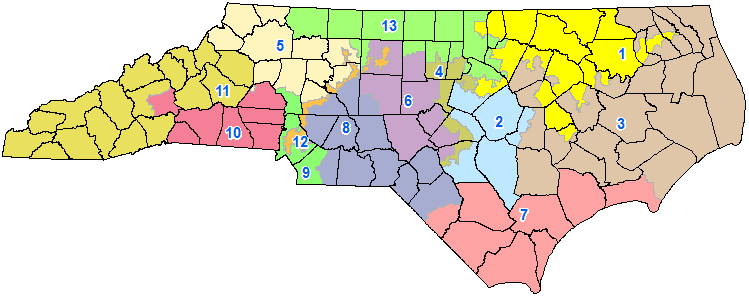
That doesn’t look too bad… except for District 4, which is a weird shape. And District 12, which appears to be barely connected at the top. And district 1 has some curious extensions as well. And district 9 almost completely surrounds 12.
There are some rules that the law have generated and the courts have supported to how redistricting is done.
The first rule is that the districts should have equal populations. This can be quite difficult to achieve while following “traditional” precedents like not crossing local subdivision boundaries and the like. but the requirements are still very strict. This is a part of the Constitution.
The second rule is that of minority voting. Sections 2 and 5 of the Voting Rights Act of 1965 are involved here. Section 2 makes it illegal to draw district lines that deny minority voters an equal opportunity to participate in the political process and to elect representatives of their choice. Section 5 only applies to areas that have a history of disenfranchisement of minority populations.
Section 2 prohibits lines used to dilute minority voters power if A) A minority community can fit reasonably in a geographically compact district B) Voting age minorities would represent a majority of voters in that district C) The minority population would usually vote for the same candidate D) The majority population would vote for a different candidate E) The minority vote is not otherwise protected given the “totality of the circumstances”.
They idea is to preserve the one-person, one-vote and have all votes counted equally. For example, a person in a district of 100,000 people has more voting power than a person in a district of 300,000 people. The latter’s vote has been diluted.
Now, those are the rules, but even reading them and reading many of the commentaries, it’s still difficult to decipher. What if there was an objective way to determine if the districts were gerrymandered?
That’s what Jonathan Mattingly and Christy Vaughn have done (PDF). Using a computer system to generate districts that meet the requirements of the law (same population, connectedness, and compactness), they generated several thousand redistricting maps. In these maps, they were able to alter the relative weight of each of the values (e.g. equal population being more important than compactness).
Then, they used the 2012 voting data to populate their maps with votes and determine who would have won the election in each of their maps.
There were more than 7.2 x 102784 different possible redistricting maps. Considering that there are only some 1082 atoms in the entire universe… that’s a lot. The techniques that the used are detailed in their paper.
Using a random sample of the maps they generated, they found, not surprisingly that more than 50% of the samples generated 7 or 8 Democratic representatives. All of the sampled maps (100%) produced between 6 and 9 Democratic representatives.
Compare that to the 4 that were actually received.
Through some careful tweaking of the parameters of their model, they were finally able to get a map that generated 4 representatives. However, those parameters still resulted in 90% of the maps having 5 or more Democratic representatives. Further, the high for those maps were 8 and the average was still higher than 6.5 representatives.
The conclusion is pretty striking.
It is clear that the current situation of only four democratic representatives is not representative of the will of the people. The results of the election seem to have very little to do with the will of the people. It is worth recalling that our probability distribution on all possible redistrictings was agnostic relative to the different political parties. It uses no information about the number of registered democrats of republicans in a district nor its racial or socioeconomic make up. We are simply drawing, in an unbiased way, redistrictings, favoring those which are compact and those which have approximately 1/13th of the state’s population. The results left the authors wondering, “Is this democracy?”
I’m wondering myself.