
The comments on a recent post quickly left the main topic and delved into some specific claims both for and against a minimum wage increase. This weekend, I decided to test some of those claims using actual data, which, as far as I can tell, even the US government hasn’t bothered to look at.
Going into the study of the data, I had a couple of thoughts.
- If an increase in minimum wage really caused a loss of unemployment, then it should be easy to see, since the US minimum wage increased from $5.15 per hour in 2007 (in steps) to $7.25 per hour in 2010. That’s a 40% increase. Going from $7.25/hr to $10.10/hr would also be a 40% increase (allowing for rounding).
- Additionally, 29 states (plus D.C) have a minimum wage higher than the federal minimum. So, we should be able to compare the state level data for minimum wage employment to see if a higher minimum wage has an effect on employment.
- I also considered the idea that the minimum wage employment was decoupled from the minimum wage and though that population might be a determining factor in minimum wage employment.
We can call these my hypotheses.
I used several data sets and will make the entire spreadsheet available for anyone who requests it. A list of references and source material follows.
Before getting into the meat of the data, I want to point out a few things that I discovered in this process. First of all, the number of people in the US making minimum wage is really low. Looking at the average hourly wage data from the Current Employment Statistics (US Department of Labor), there is no occupation that averages the minimum wage. That makes sense, but even “Average hourly earnings of all employees, limited-service restaurants, not seasonally adjusted” is well above the minimum wage. Indeed, it’s $11.24 for 2016 (so far).
In short, it means that the average wage of fast food employees is already $4 above the federal minimum wage and $1 over the proposed $10.10 federal minimum wage (which many economists seem to like) and a mere 75 cents under the proposed $12 per hour minimum wage. The number of people that the minimum wage actually affects is staggeringly small. Except for the people who make below average wage, for example waitstaff at restaurants getting tips or, in some states, students between the ages of 16 and 17 who work for the summer only… yep, they aren’t required to be paid minimum wage in some places.
To show this, I created a graph from the data I collected. This data show the total people in the US making minimum wage since 2003 and the people making less than minimum wage since 2003.
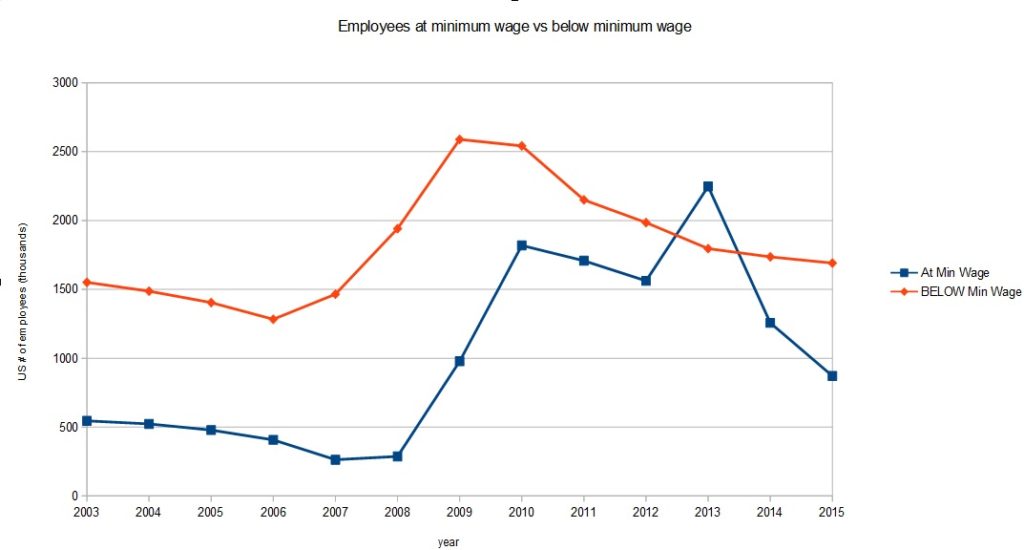
The number of people making minimum wage is much less (except for 2013) than people making less than the minimum wage. Which leads me to wonder, why do we call it a “minimum wage”. Another data set suggested that since 1979, the number of total jobs has trended upward, while the number of minimum wage jobs has trended downward.
This graph also points to something that one of my commenters brought up. The Congressional Budget Office suggests that increasing the minimum wage to $10.10/hr would reduce employment by 500,000 to over 1,000,000 people.
This doesn’t pass the smell test to me. Presumably, an increase in minimum wage would directly result in the loss of jobs for people making the minimum wage. After all, the majority of employees in the US are making above the minimum wage now and that wouldn’t change if the minimum wage went up to $10.10. Compare to the chart showing the 2015 minimum wage employees. There are 871,000.
So, is the CBO is suggesting that it is possible that every single person now making minimum wage will lose their jobs? I find that unlikely in the extreme. Could a $10.10 minimum wage increase harm people making more than that? Maybe, but why would it? The business is already paying them more than the current or proposed minimum wage. Presumably because they are good employees.
In total, as of 2015, there were 2.5 million people at or below minimum wage. The CBO claims that 40% increase in the minimum wage will reduce employment by between 20% and 40%. Fortunately, we can check that using historical changes in the employment of minimum wage earners. Note that, for all future statements, the word “states” also includes the District of Columbia, thus there are 51 “states”.
Change in employment from 2006 to 2009
First, I considered the change in minimum wage employment between 2006 and 2009. In 2006, the US federal minimum wage was $5.15. It increased to $5.85 in 2007, $6.65 in 2008, and to the current value of $7.25 in 2009.
There was a mild dip in employment from 2006 to 2007. The total employment for that transition year dropped by 144,000 employees.
In 2008, the minimum wage job market increased by 24,000 jobs. And in 2009, it increased by 691,000.
Over this period, 43 states had an increase in their employment of minimum wage workers. Seven states had a decrease and Connecticut stayed the same.
In terms of actual employment numbers, Ohio had the worst time of it, going from 29,000 minimum wage employees to 20,000. While Texas brought in over 100,000 minimum wage employees.
Now let’s compare two years, with the same minimum wage, 2012 and 2015. In this case, the national percent change was a reduction of 44%. Forty states saw a decrease in minimum wage employees, while only 7 states had an increase and 5 states stayed the same. Curiously, 5 of the 7 states (excepting for Montana and Connecticut), with an increase in minimum wage employment in this time frame are in the Southeast US.
The immediate thought upon discovering that stat was that those Southern states are generally very politically conservative and reject a minimum wage increase. That, is true. All of those 5 states either do not have a minimum wage (and thus use the federal one) or have a state mandated wage that is the same as the federal wage.
However, Montana has a minimum wage 80 cents greater than the federal min. Connecticut has a rate that is just under $2 per hour more than the federal limit.
Interestingly, other Southern states are also a mixed bag. Both Texas and North Carolina have state mandated rates the same as the federal rate and both lost employees (60% drop for Texas and 25% drop for N.C.). Georgia has a state mandated minimum wage of $5.15/hr. Thus, jobs not under the Fair Labor Standards Act are paid much less than minimum wage. Georgia had a 23% drop in minimum wage employees. Florida’s minimum wage is the same as Montana and it had a 73% drop in minimum wage employment over the same time period.
As you can see from the national graph and the selected data I’ve mentioned, the number of minimum wage employees is quite variable.
However, the data shows that a minimum wage increase does not seem to have a dramatic change in numbers of employees. Indeed, it appears that the number of minimum wage employees has almost nothing to do with the actual minimum wage.
State Comparisons of Minimum Wage and Employment Numbers
Let’s talk about a few states in particular.
Oregon, has always had a minimum wage greater than the federal rate… well, at least since the year 2000. The current rate is $9.25. The data is amazingly variable.
| 2007 | 2008 | 2009 | 2010 | 2011 | 2012 | 2013 | 2014 | 2015 | |
| Federal (FLSA) | 5.15 | 5.85 | 6.55 | 7.25 | 7.25 | 7.25 | 7.25 | 7.25 | 7.25 |
| Oregon Min Wage | 7.8 | 7.95 | 8.4 | 8.4 | 8.5 | 8.8 | 8.95 | 9.1 | 9.25 |
| Employees (thousands) | 2 | 2 | 3 | 6 | 4 | 3 | 12 | 3 | 3 |
You can see that an increase in minimum wage in Oregon has no seeming pattern with number of employed at minimum wage.
A friend showed me how to run a correlation in Open Office. So, I can report now that the correlation coefficient for Oregon between the Oregon minimum wage and the employed is .33.
For those of you who don’t work with statistics, a correlation of 1 or -1 means that the minimum wage is the cause of the employment change. If the correlation is zero, then there is no statistical relationship between the two. A value of .33 is very low. In general, anything below .3 is considered to have little if any (linear) correlation.
Illinios also has a higher than federal minimum wage.
| 2003 | 2004 | 2005 | 2006 | 2007 | 2008 | 2009 | 2010 | 2011 | 2012 | 2013 | 2014 | 2015 | |
| Federal (FLSA) | $5.15 | $5.15 | $5.15 | 5.15 | 5.15 | 5.85 | 6.55 | 7.25 | 7.25 | 7.25 | 7.25 | 7.25 | 7.25 |
| Illinois Min Wage | 5.15 | 5.50 | 6.50 | 6.50 | 6.50 | 7.50 | 7.75 | 8.00 | 8.25 | 8.25 | 8.25 | 8.25 | 8.25 |
| Employees (thousands) | 19 | 13 | 12 | 14 | 3 | 21 | 34 | 29 | 21 | 22 | 31 | 15 |
Illinios has the same seemingly weird data. I say seemingly weird because it’s not what we would expect.
Here, the correlation is .46, still considered to be low correlation.
If there is a causation between minimum wage and number of employees, then anytime the minimum wage increases, we should expect to see a decrease in the number of employees. Neither state, so far shown, does that. I honestly picked these two at random. I expect all other states to be similar.
Instead, we see increases in number of employees when the minimum wage increases. We see decreases in employees when the minimum wage increases. We see increases in employees when the minimum wage stays the same and we see decreases in employees when the minimum wage stays the same.
Let’s look at two states with no change in minimum wage.
Tennessee has no state mandated minimum wage. Presumably, any employer not under the Fair Labor Standards Act can do whatever they want. That part doesn’t matter, because a US mandated minimum wage increase would not affect the FLSA excepted occupations or employers.
| 2003 | 2004 | 2005 | 2006 | 2007 | 2008 | 2009 | 2010 | 2011 | 2012 | 2013 | 2014 | 2015 | |
| Federal (FLSA) | $5.15 | $5.15 | $5.15 | 5.15 | 5.15 | 5.85 | 6.55 | 7.25 | 7.25 | 7.25 | 7.25 | 7.25 | 7.25 |
| Employees (thousands) | 12 | 7 | 17 | 16 | 10 | 12 | 37 | 64 | 48 | 46 | 117 | 65 | 35 |
That looks like the same pattern as Illinios and the national pattern for that matter. Regardless of minimum wage, there is a spike in minimum wage employment in 2010 and a fall off in 2015.
Tennessee has a correlation value of .78 which is moderate. However, I’m curious if it’s not so much an effect of the minimum wage as it is of the consistency of the data. If you look at 2010 through 2015, the variability of the employment number is quite high and not a constant trend, but the minimum wage hasn’t changed at all.
Of course, when I say that, I also realize that the correlation supports my position even more… that is, a higher minimum wage seems to cause more employment. And I don’t think that’s correct. Again, I think there are significant other factors involved that mask most, if not all, of the effects of minimum wage on employment.
Every state has this same pattern, with minor variations, of course. Using this data, I submit that the number of people employed at any particular minimum wage is not affect, at all, by the minimum wage itself or the change (or lack thereof) in minimum wage since the previous year.
Employment appears to be totally decoupled from minimum hourly wage.
State Population and Employment Numbers
Finally, I suggested that population may be a more important factor in number of employed. After reviewing the population for every state over the same 2003 – 2015 time frame, there is zero correlation. For the last two years, there’s actually a negative correlation. Since, except for a very few states, over a single year time, every state population has increased every year. For example, Georgia, between 2009 and 2010, lost about 150,000 people. Otherwise, even Georgia has steadily increased in population.
Of course, since this US census is only once per decade, these values are estimates.
Conclusion
The analysis of state level minimum wage employment and state level minimum hourly wages over the past 12 years shows little no correlation. Even across some time periods (for example 2006 – 2009), the change in number of employees was relatively consistent, regardless of change or lack of change in the minimum wage.
Likewise, 2010, had a large jump in employment even though some states (and the federal government) raised the minimum wage.
The only reasonable conclusion to this data is that there are other drivers of minimum wage employment. For example, it is possible that the introduction of the Affordable Care Act in 2010 is a driver for the massive increase in employment that year. I don’t have any data to support it, but just as a suggestion of non-economic motivators for increasing or decreasing minimum wage employment.
TL;DR: There seems to be no relation between minimum wage and numbers of employees.
UPDATE: Added some correlation stats and commentary to that “state” discussion portion.
_____________________________________
Current state minimum wages from the US Department of Labor: https://www.dol.gov/whd/minwage/america.htm
Historical state and federal minimum wages from the US Department of Labor: https://www.dol.gov/whd/state/stateminwagehis.htm
Population estimates for states from the US Census Bureau: http://www.census.gov/popest/data/historical/
Number of employed at minimum wage from the Bureau of Labor Statistics, US Department of Labor: http://www.bls.gov/opub/reports/minimum-wage/2015/home.htm
NOTE: Click on “archive” for historical data.