First, a comment on hurricane Sandy. The only reason that Sandy was a disaster is that the area that it hit wasn’t prepared. If Sandy had hit SE Texas or Florida, no one, including the people it hit would even have noticed. I’m not saying this to be mean, but New York and New Jersey are not prepared for any type of hurricane.
The majority of people in the area that I’m from don’t even think about evacuating until a hurricane is a category 3 or higher. We’re used to being without electricity for long periods of time (4-6 weeks during Rita and Ike). We have supplies stored no matter what’s going on. I’m sure that some people were prepared for Sandy, but it’s not a mindset that the NE US has.
I’m afraid that they are going to have to learn that mindset and sooner rather than later. The evidence points to global warming increasing the frequency, size, and later season hurricanes.
I have posted some on global warming, but I realized that we hadn’t discussed the evidence that global warming is occurring. What is it, how do we know, and what does it mean?
This is going to get kind of technical, but I’ll do my best to explain all the details.
First, and probably most important, let’s deal with this common complaint.
The global temperature can’t be higher because it snowed in Houston last year and it hasn’t done that for decades.
There is a huge difference between local weather and climate. Local weather can vary hugely over short time spans. Even a few days can make the difference (as experienced by myself) between 80°F and snowing. In Texas, it’s common to have 100% humidity and record breaking temperatures one day and near lows a few days later. That’s local weather.
Climate is the general tendency for weather over a long period of time. Southeast Texas tends to be humid and hot. This should be obvious to anyone who’s lived there for more than a few months. However, there are periods of snow and ice, and record breaking rainfall and record breaking heat. But on average, it will be hot and pretty humid.
Here’s an example, climate could be the average amount of rainfall per year. Weather is getting half of your yearly rainfall in one thunderstorm.
One of the predictions of global warming is an increase in the variability of local weather.
Warming is expected to be strongest in the Arctic and would be associated with continuing retreat of glaciers, permafrost and sea ice. Other likely effects of the warming include more frequent occurrence of extreme weather events including heatwaves, droughts and heavy rainfall events, species extinctions due to shifting temperature regimes, and changes in agricultural yields. Warming and related changes will vary from region to region around the globe, though the nature of these regional changes is uncertain. 4th IPCC Report
Yes, global warming predicts that snow could fall in SE Texas. It’s because of the massive changes the heat is causing on the Earth. While we’re talking about heat and temperature…
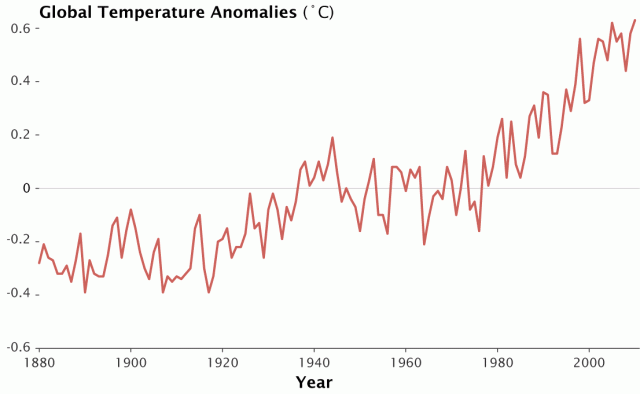
The simplest way to look at this is to examine the actual global temperature, all over the world, and average those temperatures together and get a ‘global average temperature’. While this method does a good job of highlighting the issue, it isn’t quite as useful scientifically because some weather stations stop, some start, there are conversions of data, etc.
But the results are still pretty good for the average person and very telling.
2012 was the warmest year ever on record. That bumps 2005 and 2010 to the second and third warmest years since 1880. Over the last 130 years, nine of the ten hottest years on record have occurred in the last 10 years. The years 2000-2009 is the warmest decade on record and with 2012 being hottest and 2011 in the top 11, the 2010-2019 decade may be hotter still.
GISS_annual_temperature_anomalies
Here’s where it gets pretty ugly. Since 1970, the average increase of the global temperature has been 0.36°F per decade. That doesn’t sound like too much, except it’s been over 40 years since 1970 and the global temperature has risen 1.4°F and the rate seems to be increasing.
That sounds like global warming to me.
What about longer periods of time?
Well, we can look back in time at the temperatures by using several methods. We have to use proxies, since there really weren’t global temperature records made before 1880.
Fortunately, there are a variety of methods we can use. This is important because we compare the different methods to see if we get the same results. If we don’t get the same result then we know something is wrong somewhere.
However, we do get very close results with these different methods. One methods we can use to get that data is dencroclimatology, in which we use tree rings to infer higher temperatures. The isotope composition of snow (packed snow from the antarctic and artic), corals, and stalactites can be used as well. We can also observe the change in treeline, deserts, etc.
Now, as a single test, these pieces of data wouldn’t be very useful, but as a group, they all point the same way.
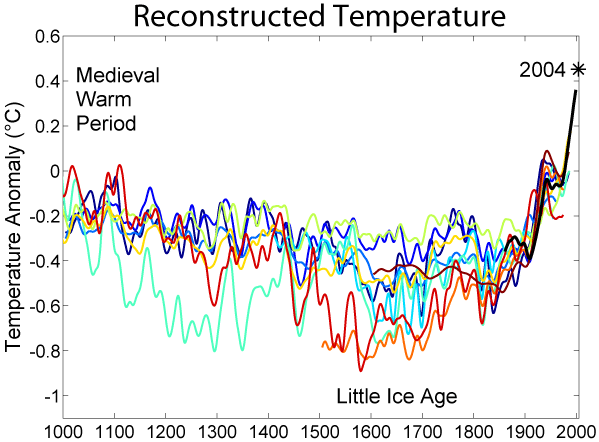
Here’s a reconstruction of the temperature changes for the last 1000 years based on this kind of data. Remember, they all agree with each other, which is a very powerful indicator that we are correct.
1000_Year_Temperature_Comparison
Notice how each method (each colored line) gives a different result, but the trends agree with each other. Further, look at how they all cluster closer together in the present. Much like evolution, it’s not one data point over 100 years, it’s millions of data points over thousands of years. Each point must be refuted if the denialists are to discredit global warming.


