Category: Statistics


(Submitted by Skepticality listener and friend of the blog Christopher Brown.

Hi all:

My son, Ethan Brown performs a Mental Mathematics stage show. A few months ago, he developed a new piece for his act. It’s a version of an old presentation puzzle known as The Knight’s Tour.

Traditionally, performers have allowed audience volunteers to select a square on a Chessboard. The performer then begins on that square and theoretically moves a knight around the board using only legal knight moves (which are “L” shaped). The goal is to land on every single square on the board without landing on any square twice.

Ethan adds an additional twist to this trick by allowing the audience to also select the final square on which the knight must land, finishing the puzzle.

Since debuting this new trick, he has had a chance to perform it 5 times. 3 out of those five times, the two audience members selected the exact same two squares (only they were reversed in one of those times). Our back of the envelope calculations place the Mathematical odds at 1 in 107,374,182, though I suspect something else might be going on here. We have video of 2 of the performances if you’d like to see it. Could there be something psychological that causes people to gravitate to these squares much like people often pick “Ace of Spades” when asked to randomly think of a card?

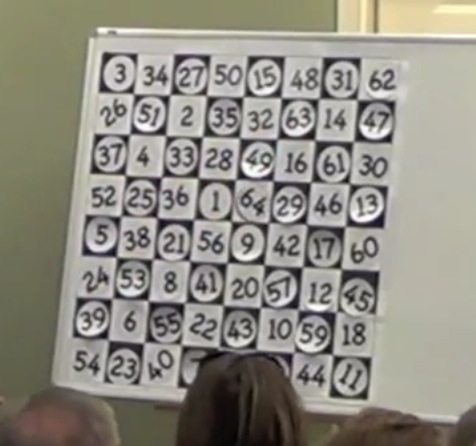
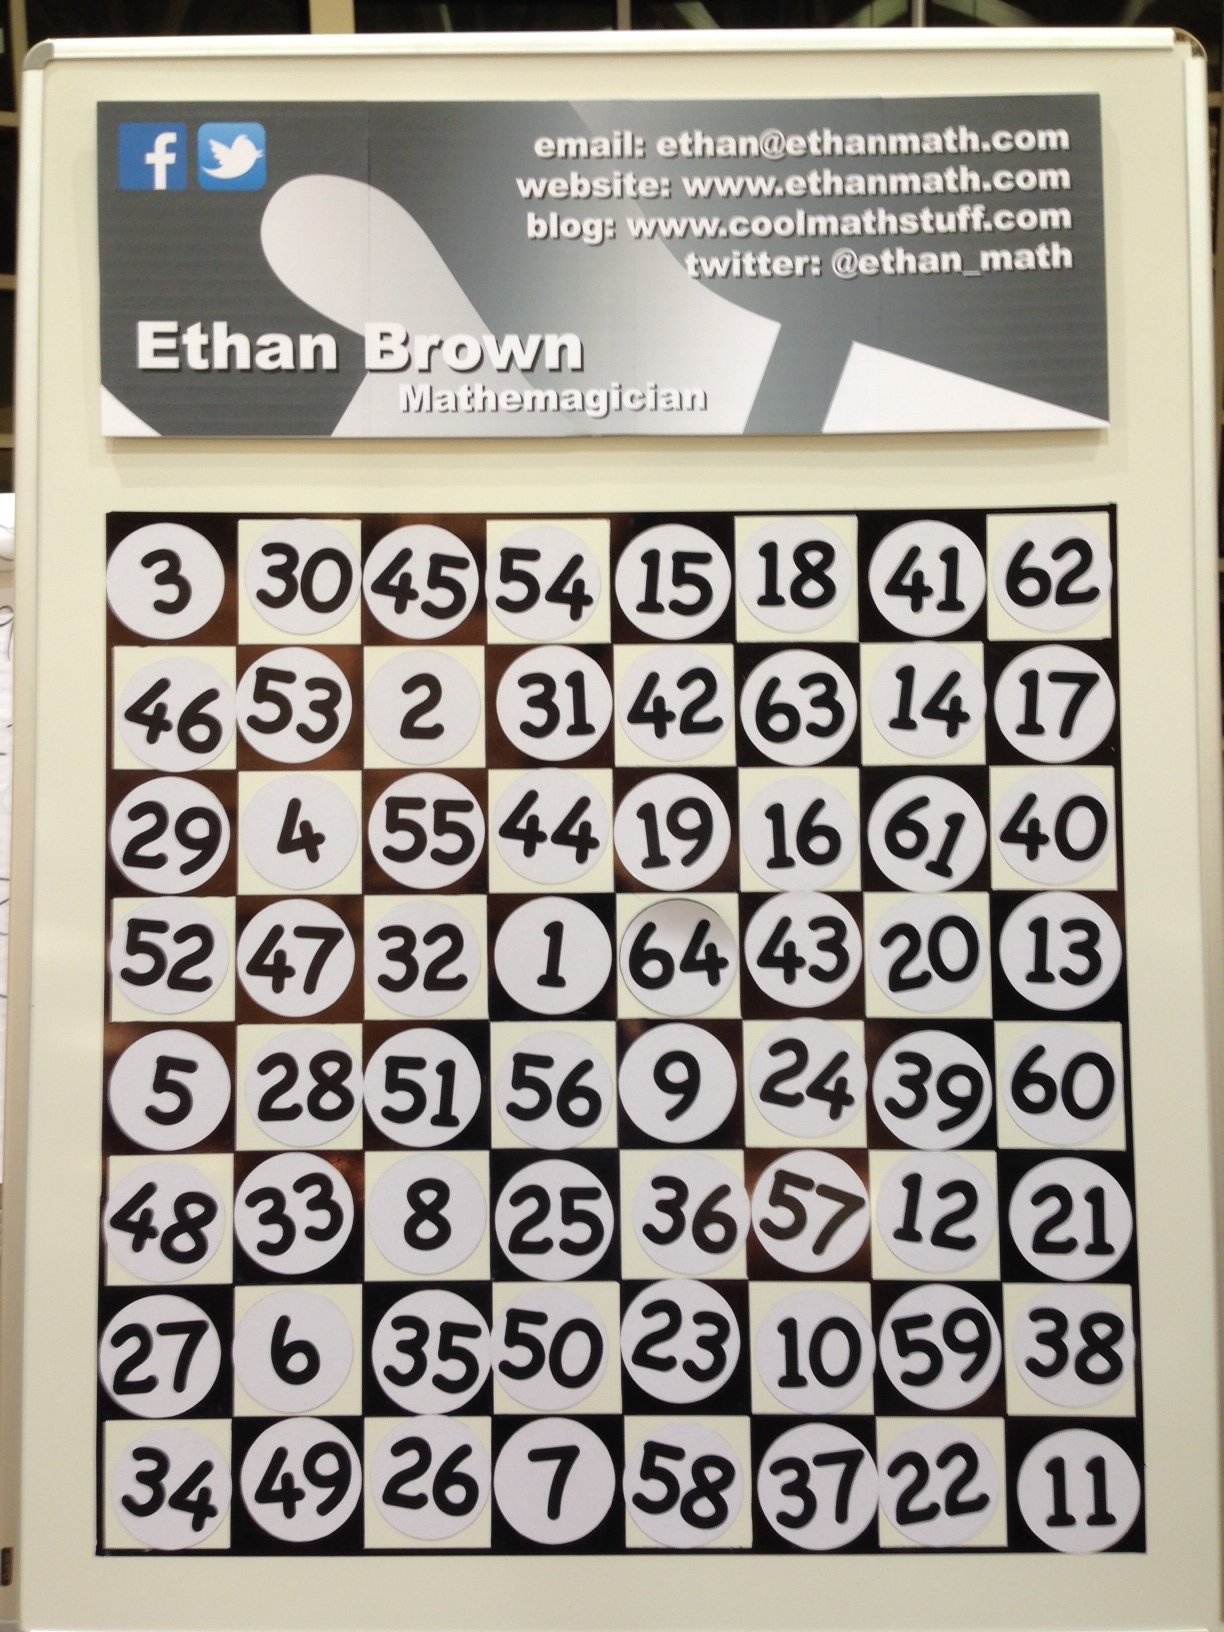
I have attached photos of the three final Knight’s Tours. Note where the numbers 1 and 64 are.

KnightsTour1

KnightsTour2

KnightsTour3

Thanks! Let me know if you have any questions at all.


Below are the extended notes provided by cognitive psychologist and statistician Barbara Drescher for use in Skepticality Episode 244.  Take a look and leave your comments below. Also, please be sure to listen to the podcast for our own hilarious commentary. Also, visit Barbara’s blog.

These notes are a bit dense for the podlet, but maybe you can use the story and just skip most of the math.

+++++

First, let’s assume that the choice of square is completely random in all cases.

We are not particularly interested in the odds that the audience would choose those squares because it’s not the squares themselves that are interesting. It’s the fact that the audience chose the same squares the second time Ethan performed the trick. Therefore, we are given the squares by the first audience and we want to calculate the probability that the second audience would choose those particular squares.

To calculate the odds of choosing those particular squares, we must first note the odds for each, which are pretty easy. The odds of choosing the first square are 1 in 64, or .015625. The odds of choosing the second square are 1 in 32 (since you are limited to only white squares and all white squares are available), or .03125. The odds of choosing both is:

.015625 x .03125 = .00048828125 or 1 in 2,000

1 in 2,000 is the probability that the audience will choose the same squares on the second round that it did on the first round.

The third instance is a bit different because, although the audience chose the same squares, the starting and ending squares are backwards. The calculation is partially the same, but if we allow either square to be the starting square, we are now asking a different question. We now want to know the probability of choosing that specific black square to start and white square to end, or that particular white square to start and black square to end. So, we start with the probability of each scenario, which we know to be about 1 in 2,000, then double it (it is not possible to choose both, so there is no joint probability to subtract). So, the probability of choosing either the same squares or the same squares in reverse on any subsequent game is about .00098 or about 1 in 1,000.

Since each time Ethan performs this trick, there is about 1 in 1,000 chance that the audience will choose those same squares as start/end points, the probability that it would happen on the 3rd, 4th, or 5th time that he performed it is about 3 in 1,000, or .003.

So, taken as a whole, the probability of the audience repeating the first (exact) choices on the second performance and choosing the same squares on one of the three subsequent performances is about .0000015, or 1.5 in a million. So not quite one in a million…

But that is all assuming that the choices were random. I saw nothing in Ethan’s posture or delivery that would suggest any given square as a starting point. However, we do know that human beings don’t do anything at random. I doubt that anyone has conducted studies to determine which squares someone is likely to choose if they are in this particular situation, but I think it is fairly safe to say that they are at least twice as likely to choose squares in the middle of the board than on the edges. I would be interested to find out if that is true, but let’s assume that number is accurate.

That changes the entire game.

We could simply double the probability of choosing those same squares in the second performance, but that wouldn’t give us the whole picture. Now we have to consider the probability of choosing those squares in the first round, because it is no longer a uniform distribution.

If we consider that someone is twice as likely to choose a square that is not on the edge, the probability of choosing that particular square is now .02, or 1 in 50. Likewise, the probability of choosing an ending square that is not on the edge is about 1 in 25. So the probability of choosing those particular beginning and ending squares is:

.02 x .04 = .008 or 1 in 125.

And now the probability of choosing the same squares, with either as the starting square, is about 2 in 125.

And that makes the probability of this scenario about 1 in 31,250.

But I think it is worth noting that the probability of those two squares being chosen at any given performance is independent of the outcome of other performances. It ranges from 1 in 1,000 to 2 in 125, which isn’t exactly “crazy”. But if it keeps happening, I’m going to think seriously about setting up a betting pool.

(Submitted by Friend of the Blog and Skepticality listener Brian Hart)

As my wife and I turned on the TV to watch the latest episode of Nurse Jackie on Showtime, it was randomly on another channel.  The movie it was showing at that time was the 2005 Charlie and the Chocolate Factory and we switched over to Showtime.  The Nurse Jackie episode was called “Candyman”, and was about the death and funeral of the hospital’s news and candy vendor.  It featured the cast singing the song “Candy Man”.

Only one fly in this (chocolate?) ointment, that song only appeared on the original Willy Wonka and the Chocolate Factory back in 1971.  Who can possibly tie this coincidence together?

“The Candy Man can 
cause he mixes it with love 
and makes the world taste good”

Below are the extended notes for use in Skepticality Episode 237 provided Edward Clint.  Clint produces the Skeptic Ink Network and writes about Evolutionary Psychology, critical thinking and more at his blog Incredulous. He is presently a bioanthropology graduate student at UCLA studying evolutionary psychology.  Take a look and leave your comments below. Also, please be sure to listen to the podcast for our own hilarious commentary.

There might be more pop culture and media references to the beloved 1971 film than you realize. The classic Wonka film has had it’s fire rekindled after the advent of VHS home video, then with the DVD release, and again following the 2005 theatrical re-make (which does not include the song in question!) In fact besides Nurse Jackie, there are at least 17 different references, playings of the song, or parodies in recent media including films the Ice Age (2012 sequel), and TV shows including Futurama, Family Guy, The Simpsons, Gilmore Girls, and Malcolm in the Middle. The younger folks on the internet are also acutely aware of the Wonka image meme still widely used and circulated today.

Would it be considered a coincidence if you saw the movie playing after hearing a song by the band “Veruca Salt” on the radio or internet? The band is named after the rich, spoiled girl in the movie. How about when Wonka was quoted in the comedy classic Super Troopers? …The entire episode from The Office which revolved around Wonka’s “golden ticket” idea?

Still, Brian, the two references co-occurring and you just happening to see them seems pretty unlikely. Do you think it’s more unlikely than the runaway success of the film? A film about a creepy shut-in CEO using candy to lure a starving child into a “private tour” full of secret rooms, deadly machines, and fetish-geared pygmy slaves human-trafficked into his candy sweatshop? Maybe we’re better off not not knowing the odds, or what schnozzberries actually are.

Are ‘Lucky Streaks’ Real? Science Says Yes

Maybe you’re not a gambler, but you probably have a grasp of the concept of a “hot hand” or a lucky streak. I’ve wondered before–is this a real phenomenon? My own experience suggests it could be, but one person’s anecdotes are just that. Luck-ily, a new study of online betting shows that the concept of a “hot hand” is real, but perhaps not for the reasons you might expect. The study found that when a person wins a bet, they become increasingly likely to succeed after each win. The converse is also true: Once you lose a bet, you become progressively more likely to keep losing.

The fascinating study looked at 565,915 sports bets made by 776 online gamblers in Europe and the United States, and found that, all things being equal, you’re likely to win or lose 48 percent of the time (draws presumably account for the remaining 4 percent). After a single winning bid, the chance of winning a second goes up ever so slightly to 49 percent. But here’s where things get interesting. After the second win, the chance of winning a third time increases to 57 percent. After that: 67 percent. Following a four-bet winning streak, the chances of scoring a fifth haul increase to 72 percent. The probability of a sixth win is then 75 percent, and finally, after six wins, bettors had a 76 percent chance of notching lucky No. 7.

What the heck is going on here? What probably explains this pattern is that after each win, people selected bets with better odds. Bettors appear to assume that after each win, they were more likely to lose–to regress to the mean, as they say–and so they compensate by making safer bets.

‘Winners worried their good luck was not going to continue, so they selected safer odds. By doing so, they became more likely to win.’
The study, published this month in the journal Cognition, also found that losses can breed more losses. After losing twice, the chances of winning decreased to 40 percent. After four losses, the chance of winning was 27 percent. After six duds, you have only a 23 percent chance of winning. The explanation: after each loss, gamblers on average choose bets that are less likely to turn out, apparently assuming that they are more likely to win than before–and perhaps to make up their losses (although, on average, people gamble less after each loss). As you probably know, bets with a lower chance of winning have higher payouts.

The idea that one is more likely to lose after winning, or more likely to win after losing, is known as the gambler’s fallacy (in reality, all things being equal, one is just as likely to lose or win on any given bet, assuming one is betting on independent events that don’t effect each other’s outcomes, as is the case with the vast majority of sports bets). This stands in contrast to the “hot hand fallacy”: that one is more likely to win while on a hot streak. Bettors apparently don’t generally believe this to be true, or at least their behavior suggests they don’t.

“The result is ironic: Winners worried their good luck was not going to continue, so they selected safer odds,” the researchers wrote. “By doing so, they became more likely to win. The losers expected the luck to turn, so they took riskier odds. However, this made them even more likely to lose. The gamblers’ fallacy created the hot hand.”

The researchers, Juemin Xu and Nigel Harvey at University College, London, conducted the study by examining the online betting activities of people on sports such as horse racing and soccer.

In Popular Science by Douglas Main


Below are the extended notes provided by cognitive psychologist and statistician Barbara Drescher for use in Skepticality Episode 235.  Take a look and leave your comments below. Also, please be sure to listen to the podcast for our own hilarious commentary. Also, visit Barbara’s blog. This phenomenon was discussed on Virtual Skeptics, #90. Listen, watch and enjoy: It’s like Meet the Press, but with chupacabras.

You’re perhaps not understanding what they studied.

They didn’t study something with a consistent bet. It’s more like craps. The subjects were able to choose from among different odds. After winning, people made more conservative bets–bets with better odds of winning (and presumably lower payouts). After losing, people make riskier bets, probably because those bets would pay more if they won.

So, overall, you wouldn’t win more money. You’d just win more often.


Here are links to references John Rael made in the Skepticality episode.

  • A new study of online betting shows that the concept of a “hot hand” is real, but perhaps not for the reasons you might expect.
  • ‘Winners worried their good luck was not going to continue, so they selected safer odds. By doing so, they became more likely to win.’ The study, published this month in the journalCognition, also found that losses can breed more losses.
  • The idea that one is more likely to lose after winning, or more likely to win after losing, is known as the gambler’s fallacy  (in reality, all things being equal, one is just as likely to lose or win on any given bet, assuming one is betting on independent events that don’t affect each other’s outcomes, as is the case with the vast majority of sports bets).


(Submitted by reader Chad Simonds)

This is not a story about something that happened to me, nor a third person account; but I think it’s a worthy topic nonetheless.

I’m a runner who lives in Florida.  During the summer months it is just too hot and humid to go running when the sun is out, so I’ve taken to running only during thunderstorms. I understand that the odds of being struck by lightning are very minute, but I’m wondering how those odds are actually calculated.

Does the currently understood odds of being struck by lightning take into account how much time one spends outside during a thunderstorm (which is presumably less time than when it’s not raining)?  If I am effectively seeking out thunderstorms, are the odds of being struck by lightning significantly greater, or are the odds still so low that I’m not really in any danger?

[Editor: Although this is a great question for The Odds Must Be Crazy, my immediate thought was about the film The Curious Case of Benjamin Button, and the short clips of the roomer in the boarding house who was struck by lightning seven times. The odds turn out to be not so crazy!

httpv://www.youtube.com/watch?v=HGBWOAhRBpk

Also – evidently being struck by lightning is not to be taken – lightly. It is the second leading weather related cause of death, after floods. According to one source, 400 people are struck by lightning in the US annually, and sixty lose their lives.

Florida is the number one state, leading the deaths by lightning at 126 from 1990-2003. If a thunder storm starts when you are out running – get inside a car or building, stay away from tall conductive objects, or curl up in a ball, making yourself as small a target as possible. –  Wendy]

Last month an article on one of my favorite websites, io9.com, grabbed my attention. It included a discussion of studies and simulations which demonstrate (and provide evidence for) some of those things in life that lead us all to think that fate is trying to tell us something. Specifically, the adage we call “Murphy’s Law” states that what can go wrong will go wrong and it is supported by both mathematical proofs and observations.

“When it comes to long strands of string, from proteins in a person’s cells to the rigging in a ship, this means spontaneous knotting. People have written papers about how string knots up the minute it’s given a chance to jiggle around.”

The article goes on to discuss a simulation of a random walk (direction for each step is determined randomly) in 3-dimensional space with the restriction that no space can be occupied more than once. The path of the walk simulates the placement of a length of string – the beginning and end of the path are the ends of the string and no part of the string can occupy the same space as another part. What the researchers found was that any sufficiently long walk (string) must contain a knot. The longer the walk (string), the more knots.

This can teach us that tossing our Christmas lights into a box is almost certain to result in knots to untangle next year, but it can also teach us a lot about risks, coincidences, and how to think about those things.

Barbara Drescher

When I was nine years old my family lived on the Great Lakes Naval Station (on the shores of Lake Michigan) for about a year before buying a house off the base. Our home was in a cul de sac that was shared by several families. One of the families of which we were particularly fond was a widower with a boy and girl about the same ages as my brother and I. Fast forward to more than four years later, after we had moved twice and now lived 2,000 miles away in Sacramento, California. We drove the three hours from our home to a tiny fishing hole called Blue Lake for a weekend of camping and fishing. About an hour after we arrived, my mother suddenly blurted out, “Hey, isn’t that Bud Neighbor [not his real name]?” Sure enough, camped a few spaces down were our old friends.

I have had quite a few similar experiences, but none as bizarre or unexplainable as this one. Should we have been freaked out and considered some cosmic connection?

To find out, let’s turn back to the article I mentioned and Murphy’s Law. Is it true that anything that can go wrong will go wrong? Well, not exactly. You can get on that plane tomorrow and be confident that you will survive the flight (your odds are approximately 9.2 million to 1). However, if you “tempt fate” enough, even the least likely disaster will eventually happen. Of course, your plan to commit suicide via commercial airliner will require you to fly every day for more than 25,000 days to ensure success, and even then you have no guarantees.

The problem of spontaneous knotting is simply a matter of odds. It relies on something called “The Law of Large Numbers”, which dictates that any event which can occur will occur if given enough opportunities.* String knots up when there’s a lot of it because there are a number of ways in which it can be knotted.

Without going through a bunch of math, let’s look at how we determine probabilities. There are two properties to consider when determining whether an event is unusual (vs. expected):

View full article »