
Over at Pew Research, Angelina E. Theodorou has posted an insightful graph showing the relationship between religiosity (as measured by Pew’s 2015 Global Attitudes Survey) and per capita GDP adjusted for purchasing power (estimated by the IMF World Economic Outlook Database). This graph is certainly worth pondering seriously, but it suffers from the fact that per capita is arithmetic jargon for the (demonstrably counterfactual) notion that wealth may be distributed evenly across all of a nation’s citizenry. Perhaps the variance in religiosity between well-developed and prosperous nations (read: OECD members) may be explained not so much by differences in per capita output between nations as by differences in how wealth is distributed within those societies.
In an effort to dip the proverbial quantitative toe into this problem, I’ve plotted the religiosity survey data from Pew against the Gini coefficients for existing OECD nations, plus a handful of economically powerful nations which have yet to join the OECD.
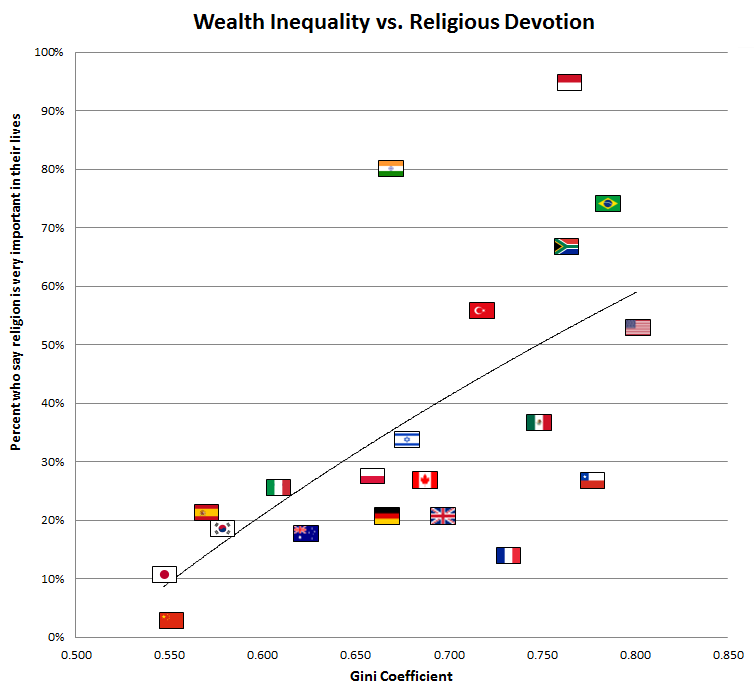
A few brief observations:
- United States no longer shows up as a statistical outlier when we are looking at inequality of wealth rather than GDP per capita.
- Indonesia‘s flag looks very much like Poland‘s flag, except upside down. Is there a bizarre international rivalry going on here, unbeknownst to provincial Americans like myself?
- India and Indonesia (both non-OECD nations) are now outliers, indicating that nations with relatively low GDP per capita may not fit well into an inequality model.
- Nations as economically disparate as Japan and China are relatively close together on this chart, despite being worlds apart on most per capita metrics, putting the previous observation in some doubt.
- Almost every nation on the graph hails from Europe or European roots. This is ably explained by either Jared Diamond or Niall Ferguson, depending on your personal political inclinations.
- If you live in an economically well-developed nation which has a Gini coefficient under .7 or so, the odds are very good that you live in a potentially post-theistic society, one wherein less than half of the population considers religion very important to their lives. If you live in a nation that is well off and yet has a higher Gini coefficient, the odds are good that either you speak French or else you don’t much follow international rugby.
That’s all for now. Please feel free to add your own insights/corrections/complaints in the comments. (Please note that it’s not my fault that Chile’s flag looks too much like that of Texas, or that Texas remains part of the United States. I had nothing to do with the relevant line-drawing in either case.)